


2024 Startup Data Unpacked, Part II
Fund performance, exits, and the talent driving it

TLDR: Fund performance is abysmal in today’s terms, but venture is a long-term game, and the return to quality and more disciplined valuations bode extremely well for the 2023 - 2025 vintages.
What 2024 Teaches Us About Startup Success
Welcome back! Last week, in Part I, we explored the foundational trends from Carta’s data—equity splits, AI’s impact, regional shifts, valuation trends, early-stage funding patterns, and more. Now, we’re diving deeper. Today’s focus: fundraising timelines, team dynamics, exit trends, and fund performance. This is where the insights meet action.
Fundraising Timelines: The New Reality
Raising capital in 2024 required more patience:
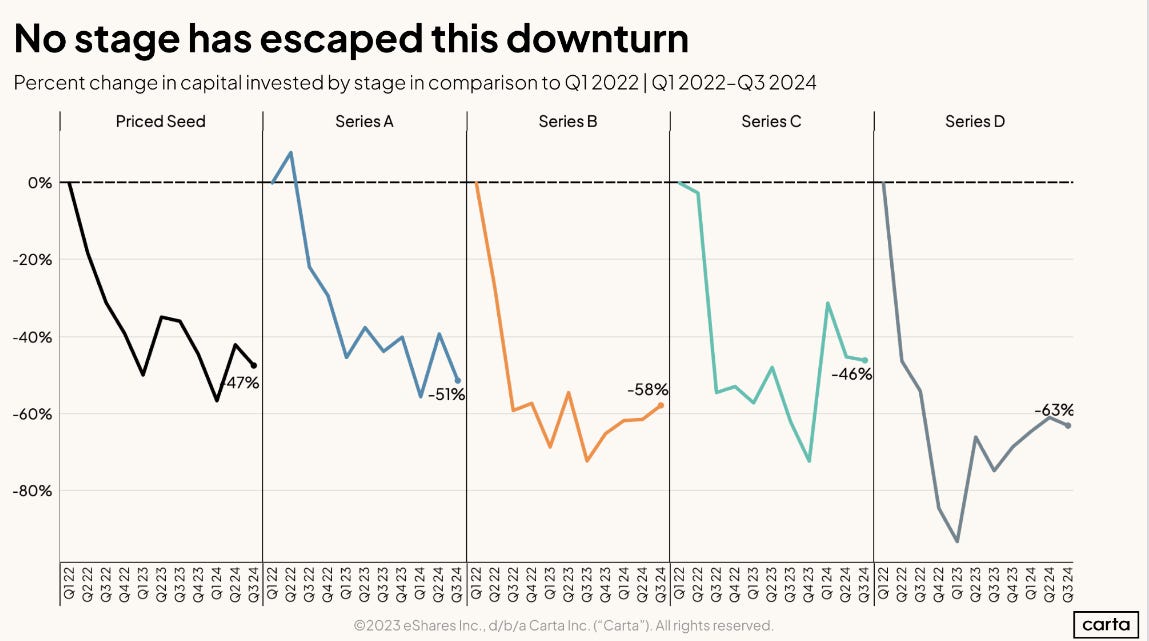
No Stage Escaped the Downturn: Funding contractions ranged from -46% to -63% across all stages compared to Q1 2022 (slide #8).
Extended Timelines: Startups now take 2.5 years on average from incorporation to raise a priced Seed round and 3.1 years to reach Series A, reflecting a gradual increase over the past decade.
Time Between Rounds: Across all stages, the average time between rounds has increased from under two years to 2.3 years (slide #9).
Down Rounds Hovering: Down rounds remained steady at 18-20% of all funding rounds, but that’s a sharp increase from just 5.6% in Q1 2022.
Perspective: Founders who can raise in this market must shift their approach to runway management. Instead of planning for 18-24 months, consider budgeting for 24-36 months of runway. However, this doesn’t mean playing it safe. Invest heavily in what works and cut what doesn’t. The founder’s job isn’t to pay people to find gold—it’s to find the gold and then invest strategically to extract it.
[See graphs on slides #8, #9, and #11: Funding Trends and Timelines]


Team Dynamics: Leaner, Smarter Teams
The slowdown in funding has significantly impacted hiring patterns:
Hiring Declines: New hires dropped from a peak of 72,377 in January 2022 to just 27,677 in January 2024, reflecting a more cautious approach by startups.
Sector Growth: Only Energy, Hardware, and Medical Devices saw hiring increases during this period, while SaaS and Fintech hiring remained flat, and other sectors contracted.
Employee Turnover: Half of employees now depart within three years, underscoring the importance of retaining key talent in leaner teams.
Smaller Teams at Series A: Startups are 20% smaller at Series A compared to previous years, signaling increased efficiency and a reliance on technologies like AI for operational leverage.
Compensation Trends: Engineering talent remains in high demand. Equity packages have shrunk but stabilized, while director-level salaries hover between $150K and $227K depending on function.
Advice for Founders: Leverage AI to maximize team productivity and focus on retaining core talent. Streamlined, efficient teams will continue to outperform in a resource-constrained environment.
[See graphs on slides #46 and #48: Hiring Trends and Team Size Data]


Exit Trends: A Mixed Bag of Shutdowns, IPOs, and M&A
2024 saw significant shifts in how startups exited:
Startups Shutting Down: The number of company closures rose sharply to 277 in Q4 2024, up from 212 a year earlier and a continued increase from just 124 in 2022 and 67 in the same period in 2021.
High-Profile Failures: Over 100 startups that had raised more than $20M shut down in 2024, reflecting the harsh funding environment and operational pressures.
IPO Activity: While IPOs were up 50% year-over-year broadly (~250 IPOs), tech IPOs have nearly vanished, with only six companies, including Rubrik and ServiceTitan, going public in 2024.
M&A Trends: Mergers and acquisitions have steadily increased for the past six quarters, with 170 transactions in Q4 2024, the highest value transacted since Q1 2022.
Implications: Founders need to evaluate their runway and liquidity options carefully. Building strategic partnerships early can create opportunities for acquisitions, while preparing for a prolonged private market environment may mitigate risk.
[See graph on slide #95: Shutdowns, IPOs, and M&A Trends]


Fund Performance: A Look at IRR and Fund Sizes
2024 data underscores a tough performance environment for funds:
Median IRR Trends: For vintages between 2020 and 2022, the top quartile Internal Rate of Return (IRR) ranged from 0% to 14.7%. Notably, 2021 vintage funds showed an abysmal median IRR of just 4.4%.
Smaller Funds Outperform: Funds under $200M continued to deliver higher returns, aligning with institutional narratives about the potential for outperformance in smaller funds.
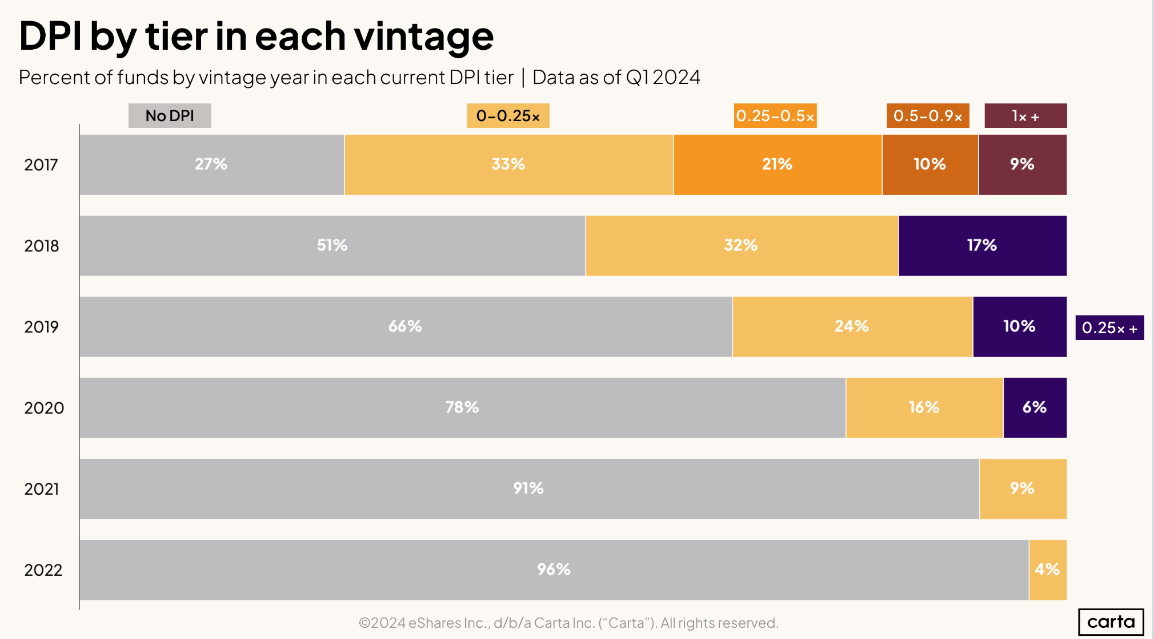
DPI Stagnation: To find vintage funds with a Distribution to Paid-In Capital (DPI) over 1x, you need to look back to 2017, highlighting the prolonged challenges in liquidity events for newer funds.
Key Takeaway: Founders should engage with funds that have demonstrated resilience and sector expertise. For investors, smaller, focused funds remain an attractive opportunity for generating higher returns in a challenging market.
[See graph on slide #76-83: Fund IRR and DPI Trends]

Final Thoughts
Overall, while the picture may look bleak on the surface, you have you to remember that venture capital, particular early stage VC, is a game of patience. Funds are meant to be ten years long, and in many cases extend well beyond that timeframe to realize real power law returns, as was the case with Airbnb—15 years to $49B, after notably selling 6% for $20K to YC and 20% to Sequoia for $375K in the earliest days.
Given the reset on valuations, the reduction of active VC firms, a focus on quality of companies that are creating real intrinsic value and customer traction, I am a true believer that 2023-2025 have a real opportunity to be the best vintages in VC history. Unfortunately, we won’t really know that until 2035.
See you Monday.
Practical.