TLDR: Peter Walker from Carta continues to pump out some of the best data and insights from across the venture capital ecosystem. He recently posted everything you wanted to know in 100 slides, and I’m going to unpack it in a two-part series.
Part I
2024 in Review: Deep Dive into Carta’s Startup Data
2024 was a year of reckoning for the startup world.
Funding patterns shifted, founder equity dynamics evolved, and new technologies like AI changed the game.
Carta’s latest report—a comprehensive analysis of over 45,000 startups managing $3 trillion in equity—delivers the most definitive look at what shaped the year.
This is Part I of a two-part series where we dissect the key insights, uncover hidden trends, and provide actionable takeaways for founders, VCs, and LPs.
Today, we focus on founder equity, AI’s impact on funding, regional shifts in startup ecosystems, valuation trends, and early-stage funding patterns.
In Part 2, we’ll analyze fund performance, team dynamics, exit trends, and the evolution of fundraising timelines.
Let’s dive into the numbers.
Money is Flowing, but not Equally.
Overall, 2024 funding grew from $74.9B to $84.3B, but the real belle of the ball was AI, and there was both a major concentration into mega deals and into mega funds.
These two dynamics really obfuscate what a challenging year it was for emerging managers to raise, non-AI companies to breakthrough, and the difficulties raising a traditional early-stage round if you weren’t going after the big AI dollars.
We’ll get to that later, and in Part II, but for today, let’s focus on the founders, the regions, valuations, and overall trends.
[See graph on slide #5: 2024 saw more investment than 2023]
Founder Equity: Balancing the Scales
One of the most telling insights from the Carta report is how founding teams allocate equity. The data reveals:
Unequal Splits Dominate: For two-founder teams, 56% split equity unequally. This number spikes to 78% for three-founder teams and a staggering 97% for teams with five founders. Unequal splits are not just common—they’re standard.
Median Equity Split: For two-person teams, the median split is 55% to the lead founder and 45% to the cofounder. Larger teams reinforce this pattern, with the lead founder typically holding significantly more equity.
Historical Trends: Over the past five years, the trend toward unequal splits has increased, particularly in sectors like AI and biotech where a technical lead often commands greater ownership.
Our Take: While the data shows unequal splits are the norm, founders should consider the long-term impact on team dynamics and trust. Equal splits, or more balanced ones, can foster stronger relationships and a united focus on the bigger picture: building a successful company. Don’t let a few percentage points fracture your leadership team. Additionally, keeping your cap table simple and transparent ensures smoother fundraising and exit processes, avoiding future conflicts or confusion.
[See graph on slides #16-19: Unequal Equity Splits Across Founding Teams]
AI’s Big Year: Disrupting Funding Dynamics
Artificial intelligence dominated headlines in 2024, and Carta’s data confirms it’s not just hype:
AI Companies Dominate Priced Rounds: Valuations for AI startups soared as investors poured capital into promising technologies. The median valuation for AI startups in Series A rounds grew by 18% year-over-year, outpacing other sectors.
Shift in Funding Priorities: The number of AI-focused investments grew across all funding rounds with median Seed valuations for AI companies growing 42% to $17.9m
Historical Comparison: In 2020, AI startups accounted for just 5% of priced rounds; in 2024, that number skyrocketed to 22%.
Commentary: The AI boom is reminiscent of the cloud rush a decade ago. Founders in this space need to move fast but stay focused on solving tangible problems. Investors, meanwhile, should scrutinize AI startups for substance over flash.
[See graph on slide #6, #37-42: AI Investment a Major Factor]
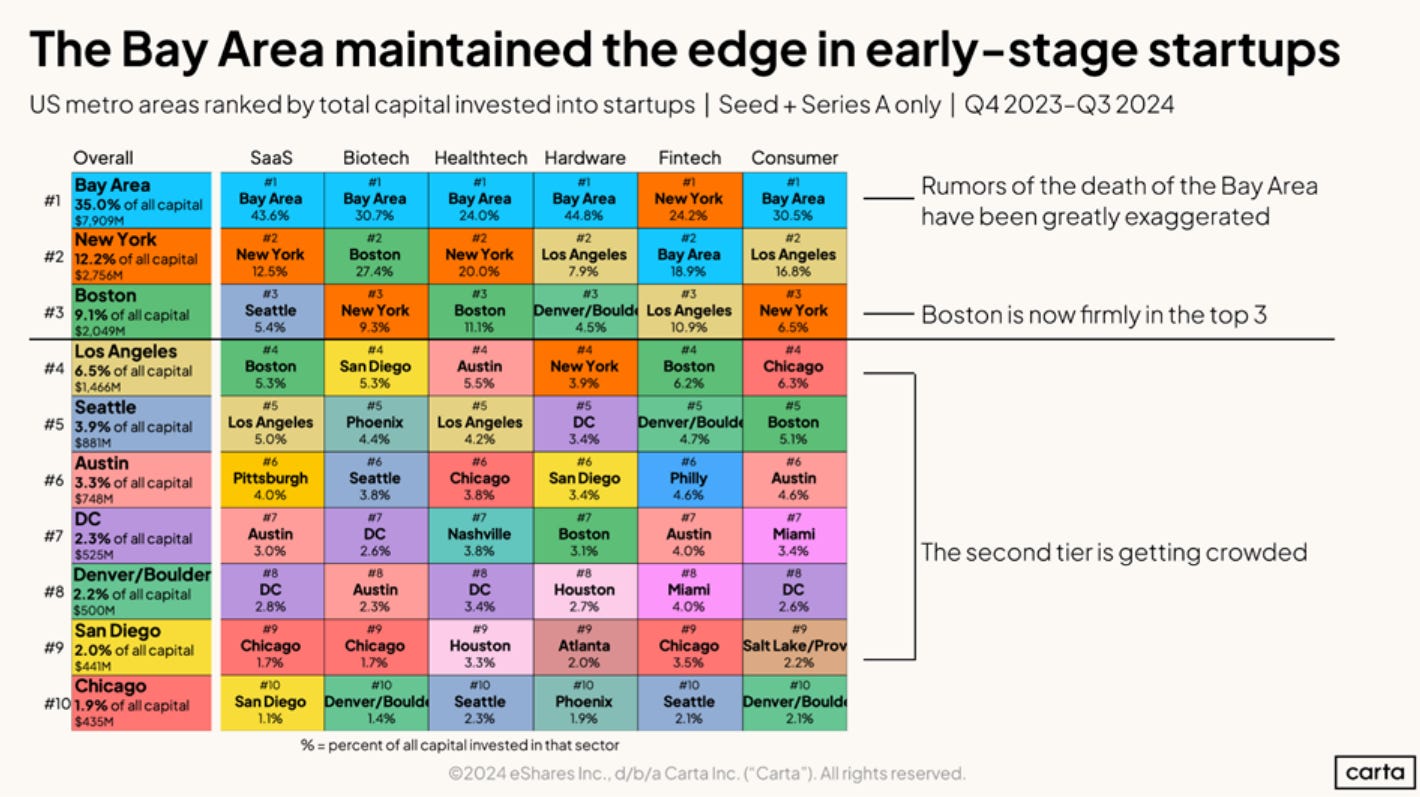
Regional Trends: The Rise of Startup Hubs Beyond Silicon Valley
Carta’s data reveals a slow but steady decentralization of startup activity:
Beyond the Bay Area: While Silicon Valley remains a stronghold, funding to startups in Austin gained ground as #6 in the US and 3.3% of all capital (748m).
New York City’s Momentum: NYC solidified its position as a major hub, leading the way in fintech, and accounting for 12.2% of all US funding ($2.75B)
Emerging Markets: Boston, LA, Seattle, DC, and Denver continue to make a push in the top 10.
Historical Shifts: In 2018, Silicon Valley accounted for nearly 50% of all U.S. venture funding. By 2024, that share had fallen to 35%, reflecting the rise of distributed teams and regional ecosystems.
Perspective: This trend benefits everyone—lower operating costs for founders, more diverse opportunities for talent, and reduced competition for local resources. However, Silicon Valley still holds an unmatched concentration of capital, culture, and expertise.
[See graph on slide #58: Regional Funding Shifts Across Metro Areas]
Valuation Trends: The New Normal
The 2024 funding environment saw a recalibration of valuations:
Down Rounds Rise: The proportion of down rounds was 18-24% in 2024, up from 5-15% in 2022, reflecting tightened capital flows and investor caution.
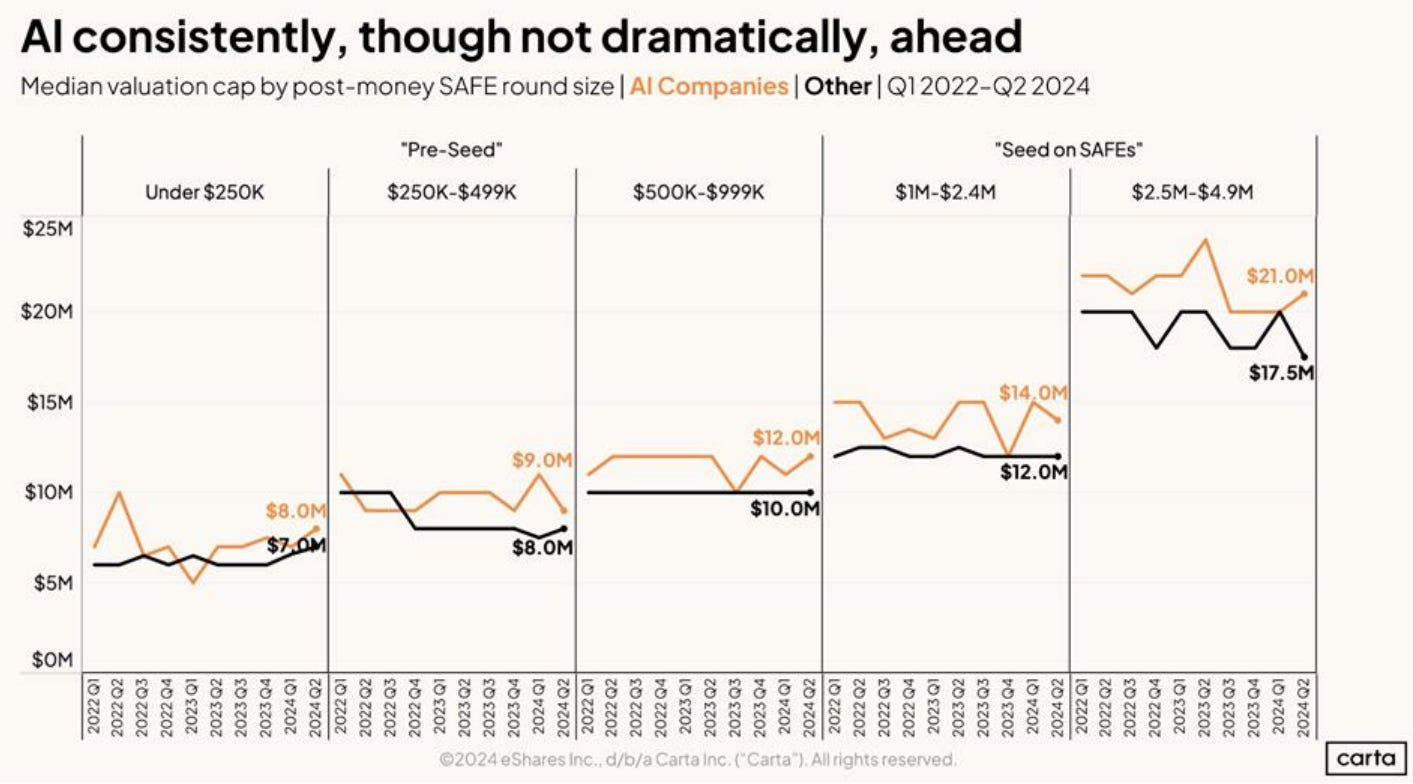
Sector-Specific Valuations: AI startups maintained its dominance, though not dramatically, as seen below.
Historical Context: The last time down rounds approached this level was in 2016, during the market correction that followed a period of frothy valuations.
Analysis: Valuation resets are not a death blow—they’re an opportunity to refocus. Founders should prioritize efficient growth and clear pathways to profitability.
[See graph on slide #13 & #31: Median valuation cap by post-money SAFE round size]
Fundraising Timelines: Longer Paths to Capital
The time between funding rounds has increased steadily, reflecting a broader shift in the startup lifecycle:
Priced Seed Funding: Startups take up to 2.5 years from incorporation to raise a priced Seed round. You can see that fundraising might be up, but early-stage has still gotten harder.
Series A: Companies typically wait 3.1 years post-incorporation to secure a Series A round, marking a steady increase from 2.8 years in 2022.
Extended Private Lifespans: Startups are staying private longer, often waiting for more favorable market conditions before pursuing exits or IPOs.
Implications: Founders need to plan for longer timelines, ensuring sufficient runway and sustainable growth during these extended periods.
[See graph on slide #7 & #11: Time Between Rounds & Early-stage rounds are harder]
In Summary
Overall, I think 2024 was perhaps one of the most interesting years in venture capital. Despite a slight rebound and increase in funding, there was a major concentration in AI. The early stages continued become harder fundraising environments, likely driven by an inability for emerging managers to raise capital (down 74%), and a concentration of capital into the mega funds and multi-stage firms.
If you’re a founder at inception just know that you need to prioritize SAFE rounds as well as speed of execution both on fundraising and product development if you want to secure those concentrated VC dollars.
In Part II, we’ll analyze fund performance, team dynamics, and exit trends.
See you Monday.


